|
Shown in Figure 2 is a typical contamination vs. time plot. As per IPC-TM-650 Method 2.3.25 (ROSE Method), ionic residues are expressed as equivalents of sodium chloride (NaCl) in micrograms per unit surface area. The sample passes the test if the conductivity (or resistivity) is less than or equal to the target conductivity (or resistivity) value, and fails otherwise.
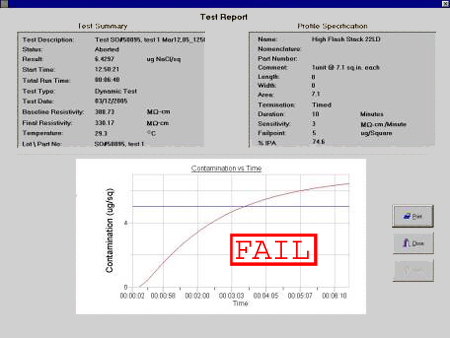
Figure 2. Contamination vs. time graph.
Applicable Specifications & Standards:
- IPC/EIA J-STD-001
Requirements for Soldered Electrical and Electronic Assemblies
-
IPC-TM-650 Method 2.3.25
Detection and Measurement of Ionizable Surface Contaminants by Resistivity of Solvent Extract (ROSE)
|